Morning Briefing — Wednesday 24 June 2026
Synoptic overview
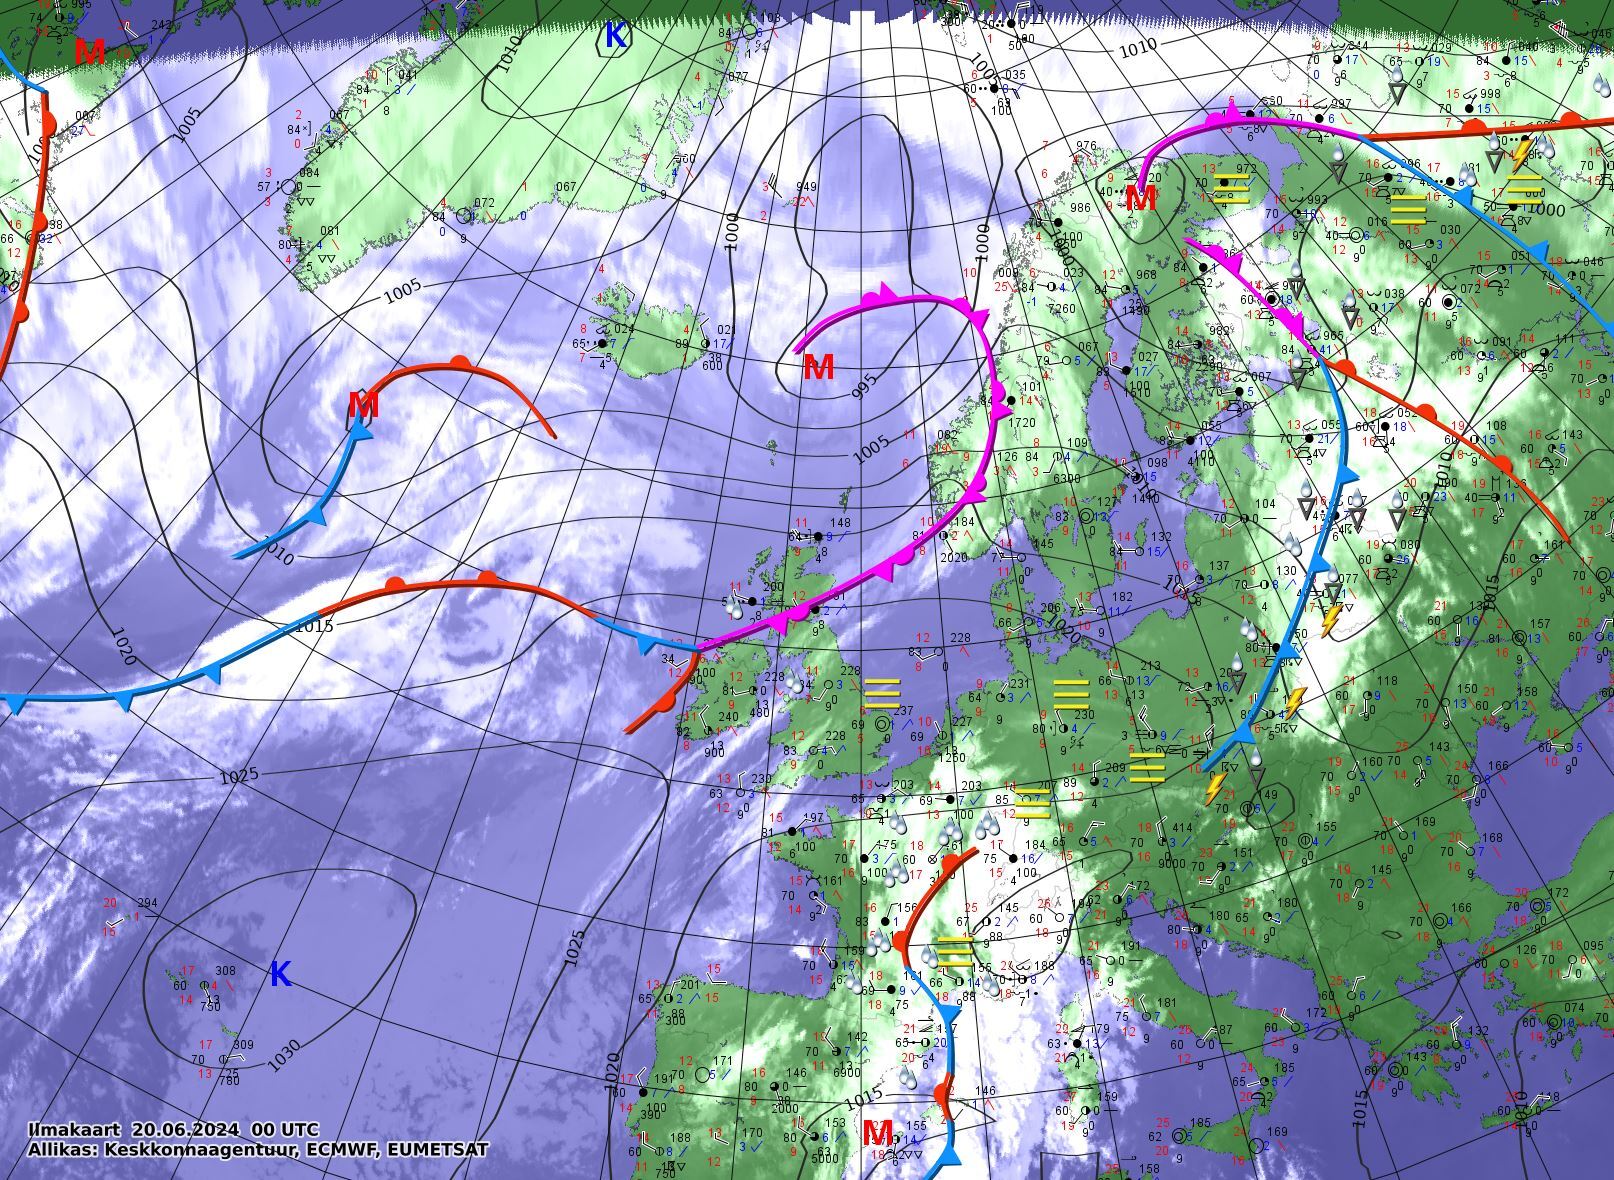
Map legend
 TT  ω  PPP
 VV  ∘  ww /
TdTd N  CL
| TT | Temperature °C |
| PPP | Pressure, last 3 digits (278 = 1027.8 hPa) |
| ω | Pressure tendency (rising/falling) |
| VV | Visibility (km) |
| ∘ | Cloud cover (fill = amount) |
| ww | Present weather code |
| TdTd | Dewpoint °C |
| N, CL | Cloud amount & type |
Long line = 10 kt (~5 m/s)
Triangle flag = 50 kt (~25 m/s)
Barb points where wind blows from
—▲— Cold front
—▲— Occluded front
💧 Rain ❄ Snow 💧❄ Sleet
≡ Fog zone
Source: Estonian Environment Agency


Charts: lennuilm.ee (Estonian Aviation Weather)
Sounding — Tallinn-Harku 00Z
Sounding unavailable for this date.

Skew-T legend
— Temperature (observed, black solid)
- - Dewpoint (observed, black dashed)
— Dry adiabats (red, slope right) — unsaturated parcel cooling rate
— Moist adiabats (green, curve right) — saturated parcel cooling rate
- - Mixing ratio (green dashed) — constant humidity lines
• Where temp & dewpoint lines are close → clouds likely at that level
• Steep temp line (follows dry adiabat) → unstable, good thermals
• Temp inversion (line tilts right with height) → thermal ceiling
• Wind barbs on the right show wind at each level
• Y-axis: pressure (hPa), X-axis: temperature (°C, skewed)
−9999 = not computed (e.g. no LFC when CAPE is zero). Indices ending in V use virtual temperature, which accounts for water vapour's lower density and is slightly more accurate in moist air.
Source: University of Wyoming, station 26038
Contrails — Tallinn-Harku
Widespread spreading contrails — expect weaker thermals under cirrus cover.
Each cell: UTC hour, temperature (°C), RHi (%). Formation needs T < −40 °C (Schmidt-Appleman); persistence needs RHi ≥ 100 % (ice-supersaturation). Spreading = ≥3 consecutive hours at or above ice saturation. At 300/250 hPa (always < −23 °C), Open-Meteo's ECMWF IFS reports RH already over ice.
Source: Open-Meteo forecast API, pressure-level variables. Window: civil twilight.
Airmass classification (2026-06-19)
Source: SSC v3.0 (Kent State University), station TLL
Current conditions — Tallinn-Harku
Source: Ilmateenistus (Estonian Weather Service)
Kuusiku XC forecast
Source: Open-Meteo forecast API (59.0°N, 24.8°E). Thresholds calibrated on 53 top-100 Rapla XC flights.
Ground conditions
Tallinn shown as reference — compare with what you see outside. Thresholds: DRY < 0.22, WET > 0.32 m³/m³ (calibrated on 114 Rapla flight dates, ERA5-Land 0–7cm). Forecast uses 0–1cm layer — values are preliminary.
Source: Open-Meteo forecast soil moisture model data (not station observations).
Metric reference
| Lapse rate | Temperature decrease per km altitude. >6 °C/km = active thermals; >9.8 = superadiabatic (turbulent). |
| Thermal ceiling | Height where lapse drops below moist adiabatic — approximate top of usable lift. |
| Inversion | Layer where temperature increases with height, blocking thermals. Common overnight; often breaks by midday. |
| Lifted Index (LI) | Stability of a lifted surface parcel at 500 hPa. Negative = unstable; < −3 = strong thermals; < −6 = storm risk. |
| K-index | Thunderstorm potential from temperature and humidity profile. >25 = showers likely; >35 = widespread storms. |
| CAPE | Convective Available Potential Energy (J/kg). Higher = stronger updrafts. >1500 = overdevelopment risk. Not computed by Wyoming for Tallinn-Harku — shown in Kuusiku section from forecast model. |
| CIN | Convective Inhibition (J/kg). Energy barrier thermals must overcome. > −50 = weak cap (easy trigger); < −200 = strong cap. |
| Thermal Index (TI) | Forecast noon surface temp minus 850 hPa sounding temp. Positive = thermals likely; higher = stronger. |
| BLH | Boundary Layer Height — mixing depth where thermals operate. >1400 m for good XC; >2000 m for excellent. |
| Soil moisture | Volumetric water content of topsoil (m³/m³). Dry soil (<0.22, Kuiv) heats air efficiently — stronger thermals via Bowen ratio. Wet soil (>0.32, Märg) spends solar energy on evaporation — weaker thermals. Effect strongest on cool/marginal days. |
00Z sounding reflects pre-dawn atmosphere (~23:30 UTC previous day). Surface inversions typically break by mid-morning. Kuusiku forecast uses 13 UTC (16:00 EEST / 15:00 EET) for peak thermal metrics — this hour was calibrated against the top-100 Rapla XC flight dates (2018–2025).
Disclaimer: Content generated using AI under guidance of an amateur paraglider pilot. Always check actual weather conditions before flying. No responsibility is assumed for decisions made based on this data.
← Dashboard · Opportunities · Skew-T · Trip Planner · Winch sites · News · Status · Generated 2026-06-24 05:00 UTC